Arbor was a mobile app that let eco-conscious users offset their environmental impact from activities such as burning gas, taking flights, or using electricity by funding conservation projects, either as one-time contributions or recurring monthly donations.
I joined as the sole designer during the push toward an MVP launch, focused on synthesizing existing user research, identifying friction points, and redesigning core screens to balance the tension between automation and emotional connection to projects. The product later pivoted to a Unity-based mobile game with a different monetization model, moving away from the offset marketplace I designed for. The work here represents the research and design direction before that pivot.
Role
Sole UX Designer
Timeline
2020–2021
Company
412 Technology
Tools
Figma
01 / Research Synthesis
Inheriting interviews, finding the patterns.
When I joined the team, they had conducted approximately 10–12 user interviews but hadn't fully synthesized the findings into actionable design requirements. I co-conducted 2 additional interviews and spent significant time analyzing all the feedback to identify patterns across competitive analysis of carbon offset apps and donation platforms, heuristic evaluation of existing screens, and usability feedback from alpha testing.
01 / Headline Tension
Automation vs. Connection
Users wanted effortless, set-and-forget sustainability, but also needed to feel emotionally invested in where their money went. Two competing demands the product had to hold at once.
"I'm lazy and busy — make it as easy as possible. Automation would be huge."
— Interview participant
02 / Dashboard Overwhelm
Visual noise on the home screen.
The grid of action buttons, stats, and project information created cognitive overload. Multiple users described the dashboard as cluttered and anxiety-inducing.
"There's a LOT of visual noise. So much clutter it makes me anxious — I'd normally bail."
— Alpha tester
03 / Navigation Confusion
Tap targets didn't match expectations.
Users couldn't figure out how to reach project details. The interaction pattern wasn't intuitive.
"It's not obvious you have to tap on the project name. I would just tap on the photo."
— Usability testing
04 / Trust Gap
Credibility markers were missing.
Several users questioned whether their money would actually fund real projects and why they would bother using our platform as a middleman.
"I'm still struggling with why someone wants to do this… I have no idea who you are."
— Interview participant
02 / Key Findings
User Priorities against Platform Priorities
Across interviews and the alpha feedback, multiple friction points surfaced, of which I've outlined four below. The headline tension - the one that shaped the most design decisions downstream - was between users wanting effortless sustainability and needing emotional investment in where their money was going.
The Offset Model
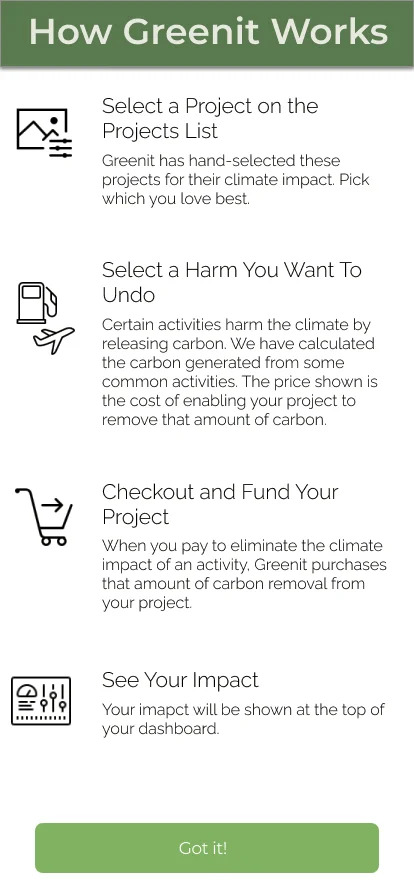
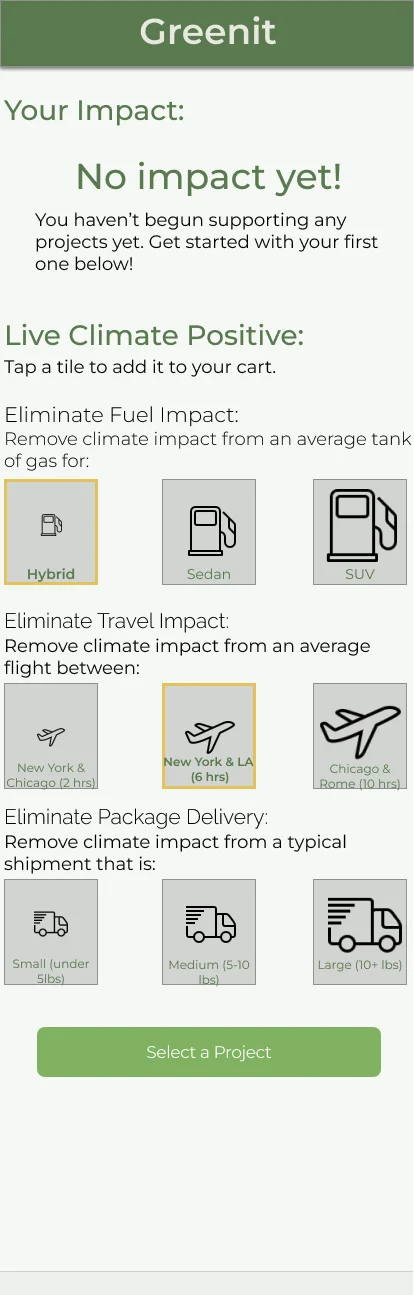
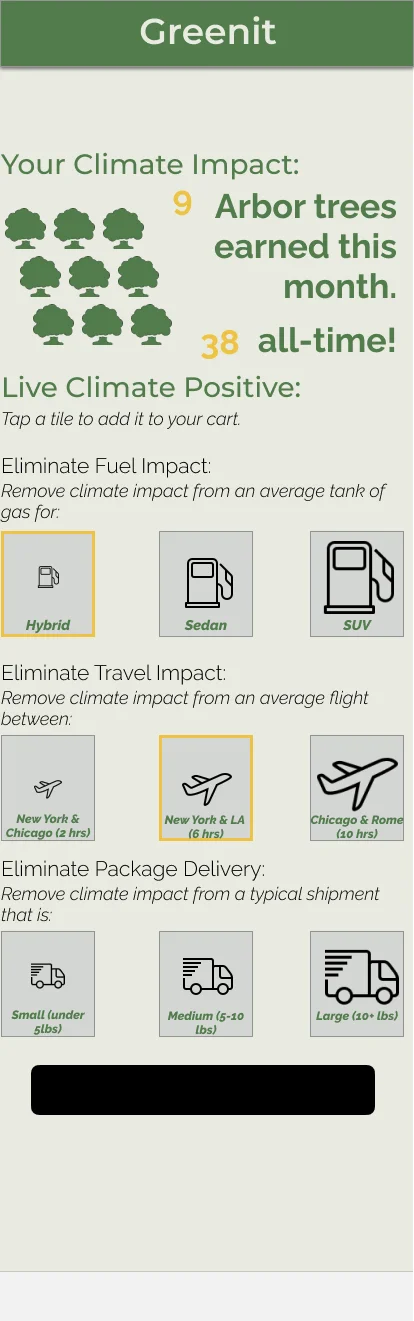
The dashboard was one symptom of this problem. The then-called Greenit (then Arbor, now Hazel) asked people to calculate their offset in the first place, and the onboarding process framed the whole app as an accounting exercise ("Select a Harm You Want To Undo"), and the "Live Climate Positive" screen turned that into a wall of granular tiles: pick your car type, your flight distance, your package weight, each priced to the pound of carbon.
OnboardingPre-engagement
1
Onboarding 2Pre-engagement
23
Onboarding 3Pre-engagement
4
1Onboarding
"Undo a harm" framing.
The app is pitched as exact carbon accounting: pick an activity, pay to cancel its emissions — an elimination model set before the user has done a thing.
2Empty state
"No impact yet!" at launch.
The first thing a new user sees is a reminder of what they haven't done.
"At launch it says 'zero months' and I immediately feel bad about myself."Gabe M · Interview
3The tile wall
A control per activity.
Fuel, travel, and package delivery each split into three priced options — every activity you might offset becomes its own decision, and the screen grows to fit them all.
"There's a LOT of visual noise. So much clutter that it makes me anxious — I'd normally bail."Kristina T · Alpha tester
4Impact header
Mixed emphasis, one stat.
"9 Arbor trees earned this month / 38 all-time" stacks three type sizes and two colors into a single line, competing with a grid of tree icons for the same space.
The pre-engagement offset flow, annotated against alpha-tester feedback.
The underlying model was one of elimination: chase an exact, complete offset of everything you'd emitted. That framing itself is what actually generated the clutter — every activity needed its own control, so the interface ballooned to match, and users were quietly told they had to account for all of it before they'd done anything at all.
I proposed the more valuable model was harm reduction, as opposed to elimination. Rather than pushing people toward an arbitrary 100%, let them contribute to projects they cared about at whatever level felt sustainable. It's the difference between "go fully vegan" and "go vegan on everything except the cheese you can't give up" — the second one is the one people actually stick with. Getting someone to do 10% of their part, repeatedly and without guilt, is worth far more than stalling them out on a calculator that implies they have to do all of it, and implicitly makes them feel as though they're not doing enough by not being maximalist.
Reduction over Elimination
Drop the exact-offset calculation as the price of entry. Instead, let people give what they can toward causes they connect with.
Automation vs Connection
The biggest tension was between wanting "set it and forget it" convenience and needing to feel emotionally connected to where their money was going.
"I'm lazy and busy - make it as easy as possible for me to be sustainable. Automation would be huge."
— Interview participant
"I need to believe that what I'm doing is bad and that this will fix it... send me the picture of the kid who's starving and who's no longer starving as a result of using this app."
— Interview participant
Supporting findings
02
Dashboard Overwhelm
Multiple users described the dashboard as cluttered and anxiety-inducing. The grid of action buttons, stats, and project information created cognitive overload.
"There's a LOT of visual noise going on here. So much clutter that it makes me anxious — I'd normally just bail and leave the app."
— Alpha tester
03
Navigation Confusion
Users couldn't figure out how to browse project details. The interaction patterns weren't intuitive.
"It's not obvious that you have to tap on the project name to get to the details page. I would just tap on the photo."
— Usability testing
04
Trust Gap
Several users expressed skepticism about whether their money would actually fund real projects. The app needed stronger credibility markers.
"I'm not really your target audience, but I'm still struggling with why someone wants to do this... I have no idea who you are."
— Interview participant
03 / Design Response
Translating findings into screens.
I redesigned three core screens to address these friction points. Shown below as original, engineering handoff, and a later refinement. Several of the handoffs were deliberately restrained — I was slotting into screens engineers had already built, and the goal was giving them enough direction without asking for more rework than the sprint could absorb. Some of what's shown as a "handoff" still carries its original spec shorthand — bracketed placeholder text like [Active / Cancelled / Error] — because that's what shipped to engineering, paired with a separate page of written notes.
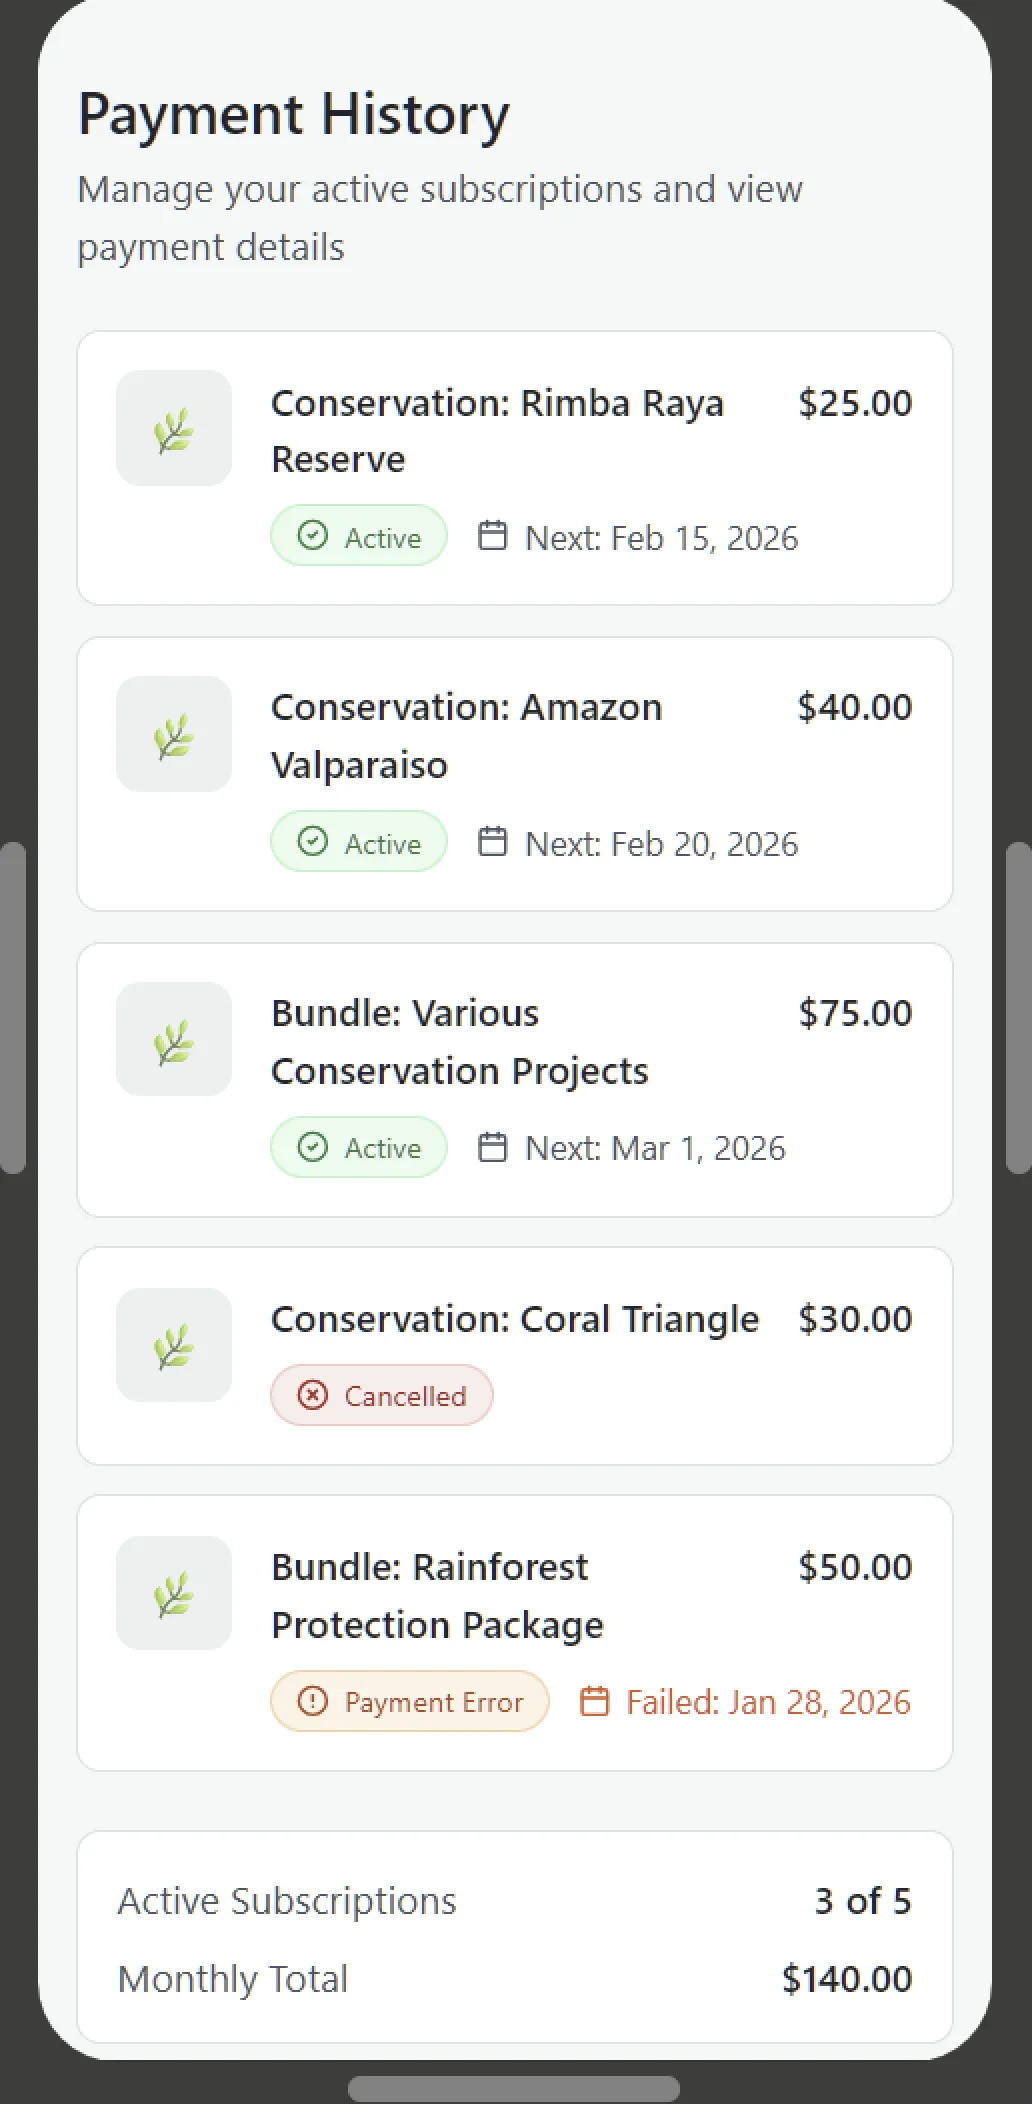
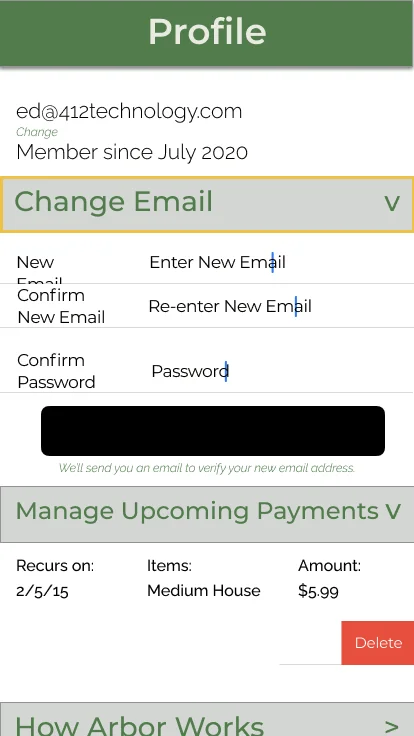
Subscription Management
I proposed replacing the generic user profile screen with a dedicated transaction management view. Research showed users wanted to split contributions across multiple projects and needed a reliable way to track recurring payments. The screen shows upcoming payments, project names, payment status (Active / Cancelled / Error), and next payment dates, giving users control and transparency over their subscriptions.
OriginalPre-engagement
Eng handoffMVP sprint
CurrentRefinement
Subscription Management — from generic profile, to engineering handoff with spec shorthand, to a transaction-focused view.
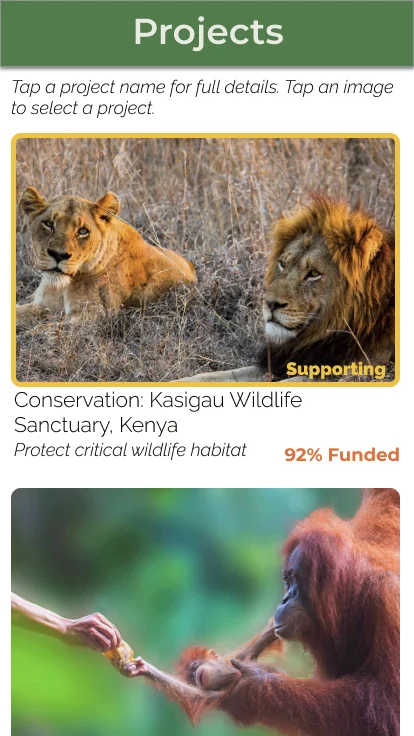
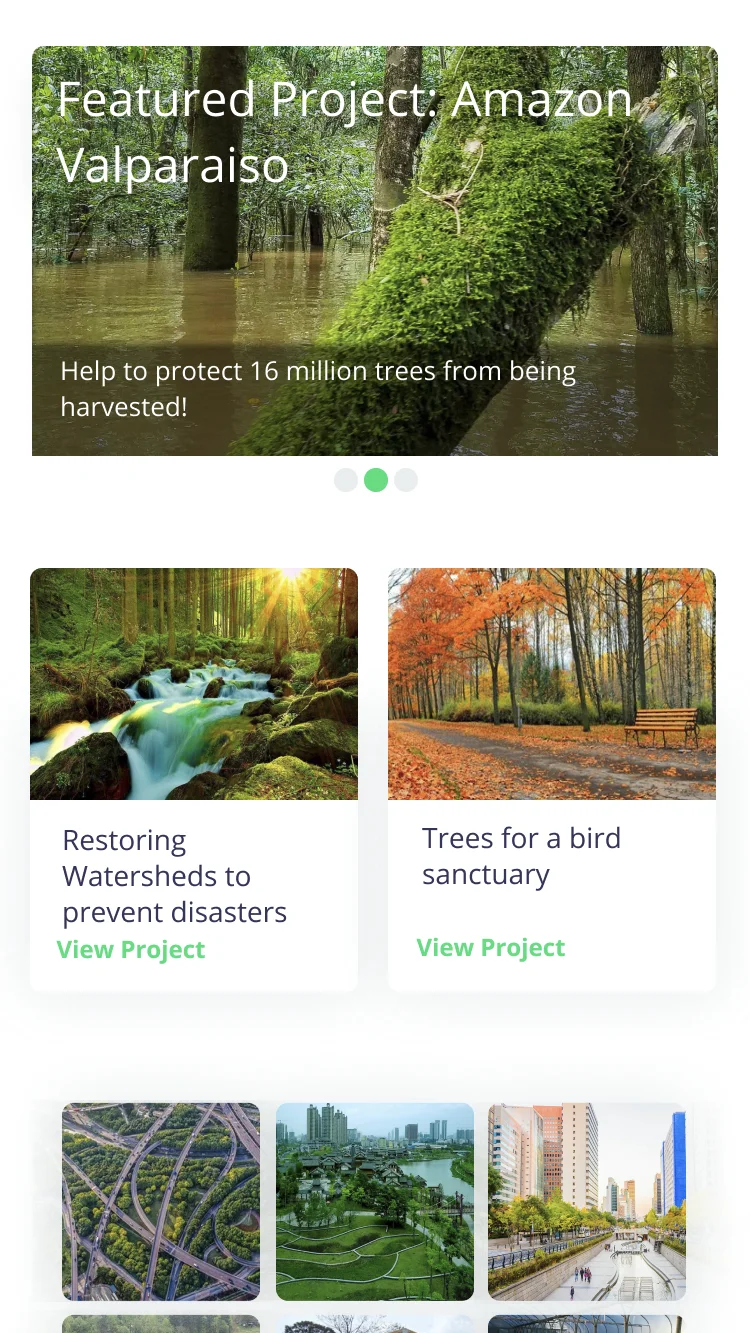
Project Discovery
The original project list felt limited and didn't take advantage of modern screen space. I redesigned it as a more comprehensive visual layout that could showcase multiple projects at once, making the platform feel expansive rather than constrained to just a handful of options. I added explicit instructional text addressing the navigation confusion users reported, and made tap targets more intuitive.
OriginalPre-engagement
Eng handoffMVP sprint
CurrentRefinement
Project Discovery.
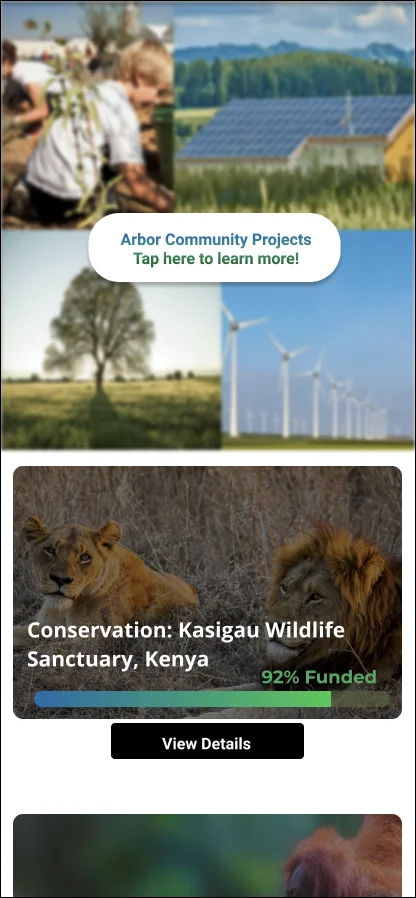
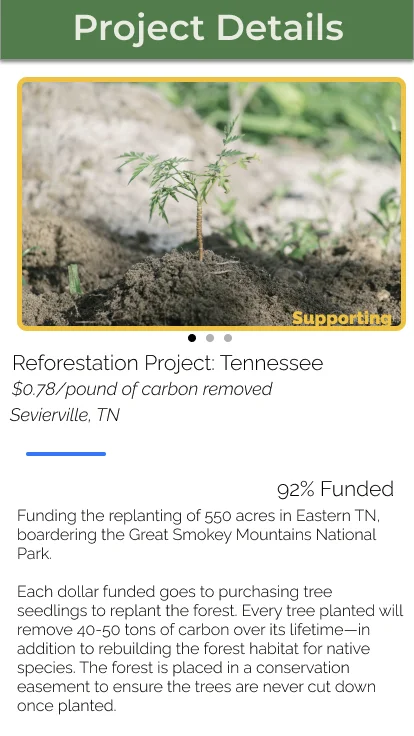
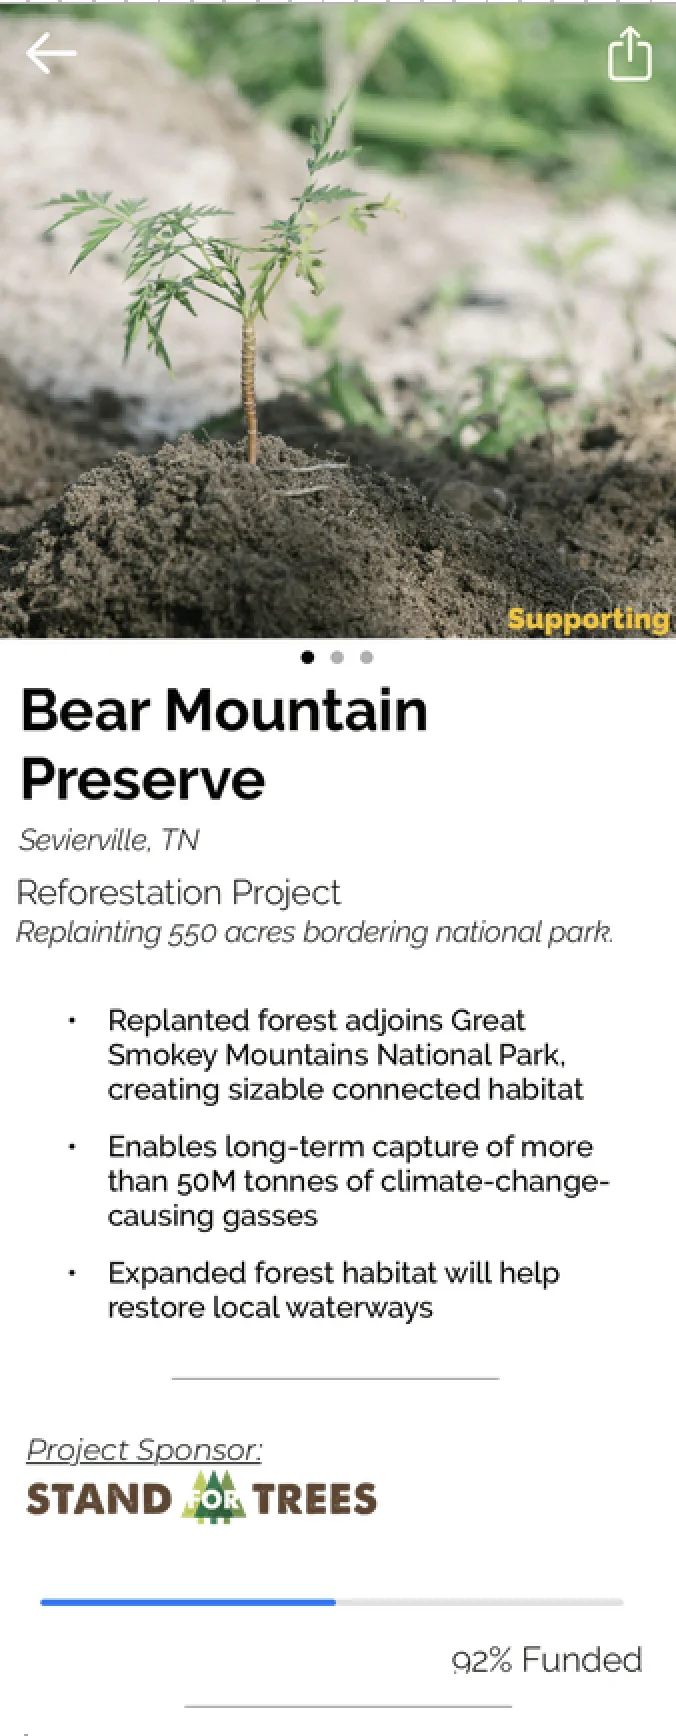
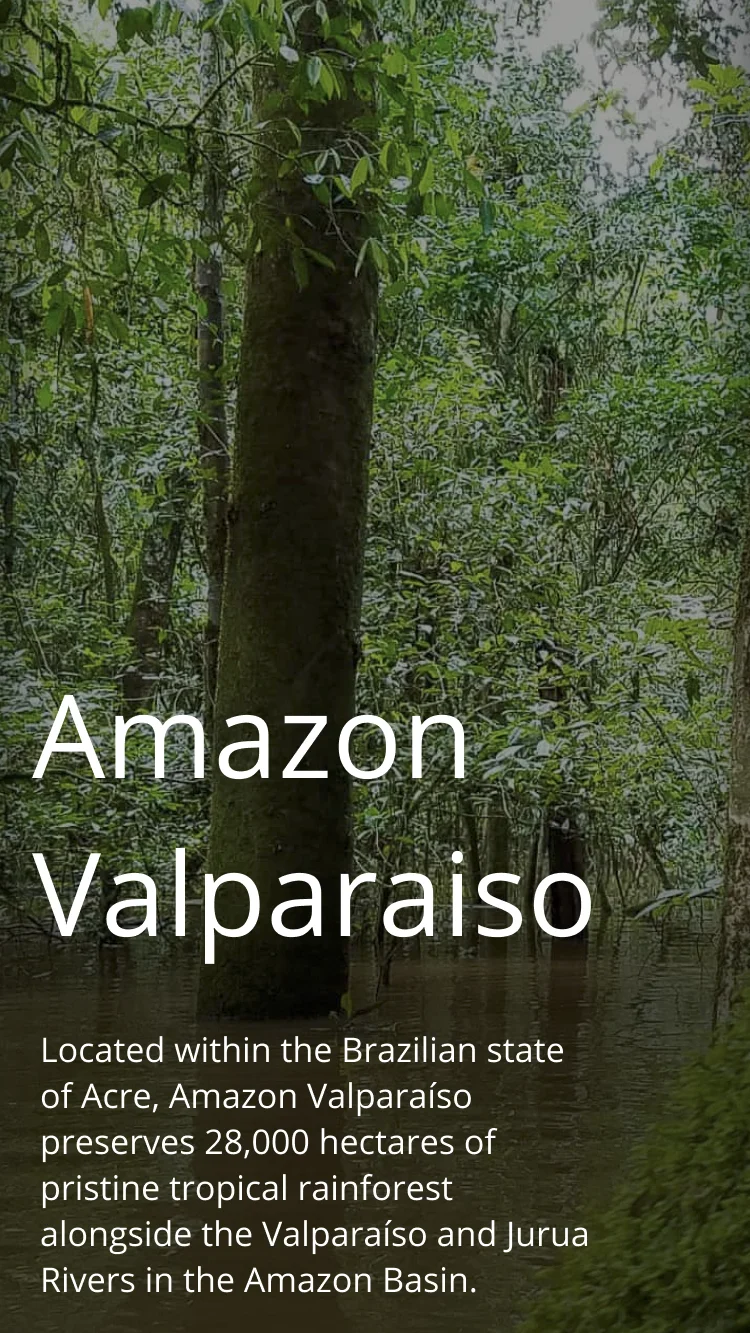
Project Details & Trust Building
To address trust concerns, I redesigned the project details page to emphasize visual credibility. Instead of walls of text, I broke information into digestible content blocks with large hero images, partnership logos, funding progress bars, and clear impact descriptions. Users doubted platform legitimacy not because of lack of information, but because the presentation looked generic. Rich imagery and concrete metrics provide visual storytelling that builds confidence.
OriginalPre-engagement
Eng handoffMVP sprint
CurrentRefinement
Project Details friendlier and more inviting interface with less whitespace. I wanted to make interface feel less like "work" and more like the user was invested in the space personally by placing them in the setting.
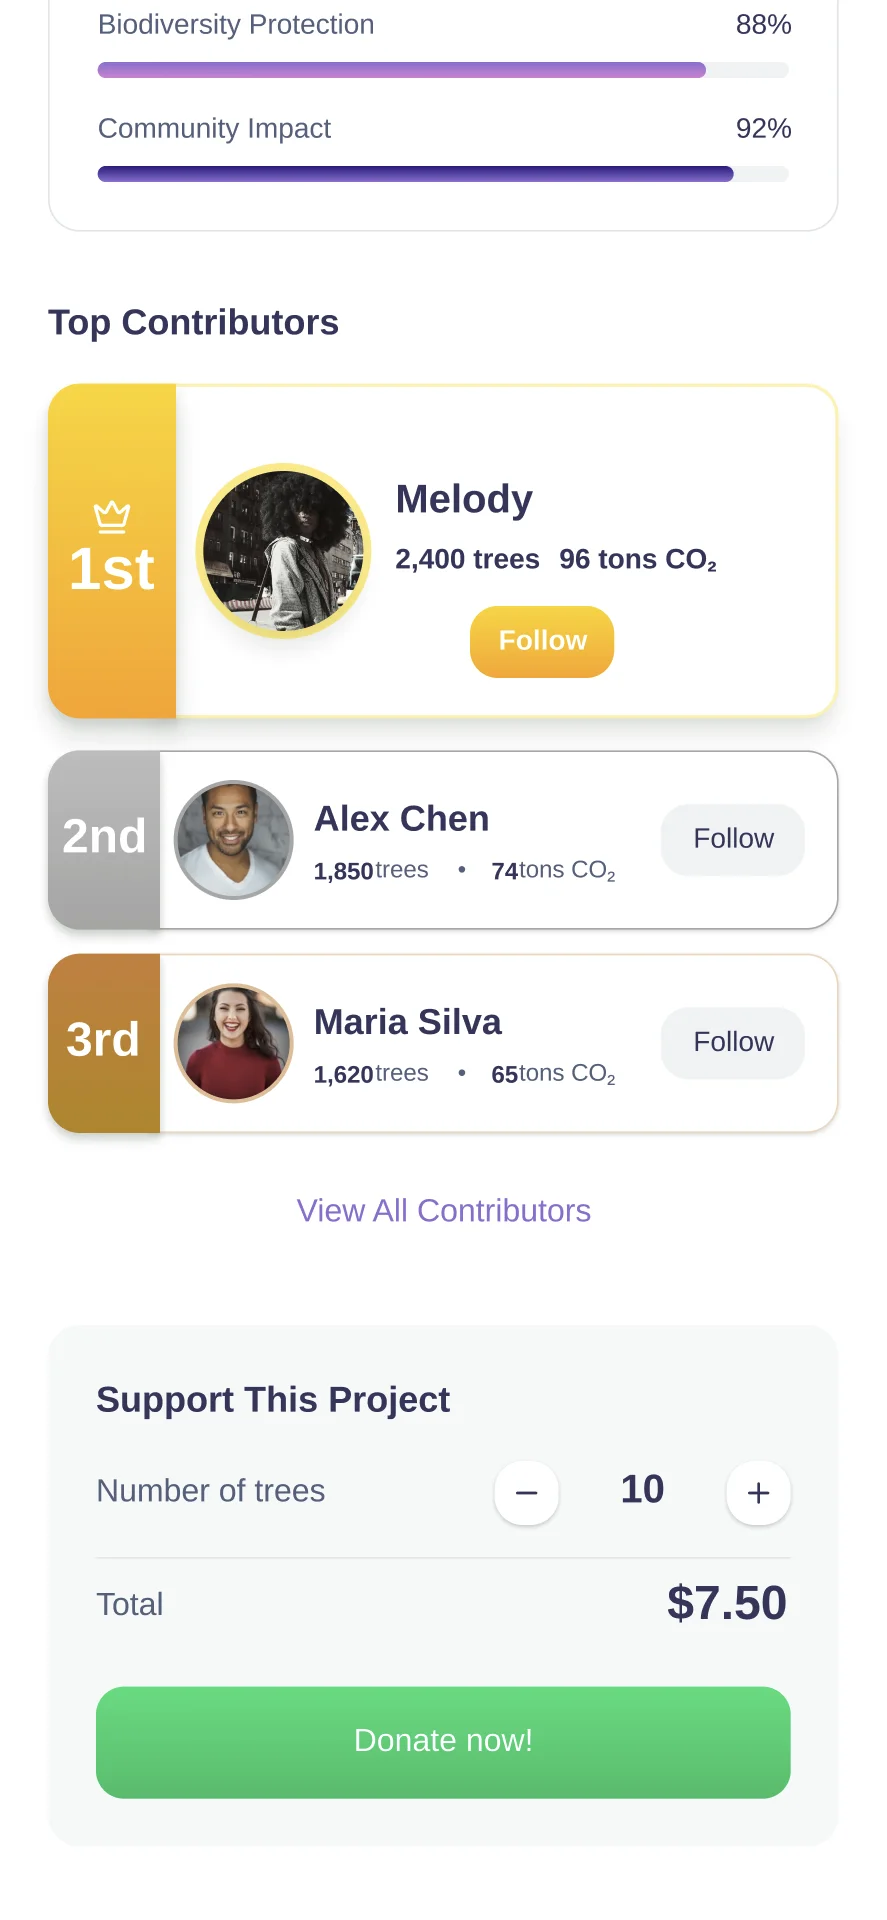
04 / Speculative Exploration
Social Elements and Gamification
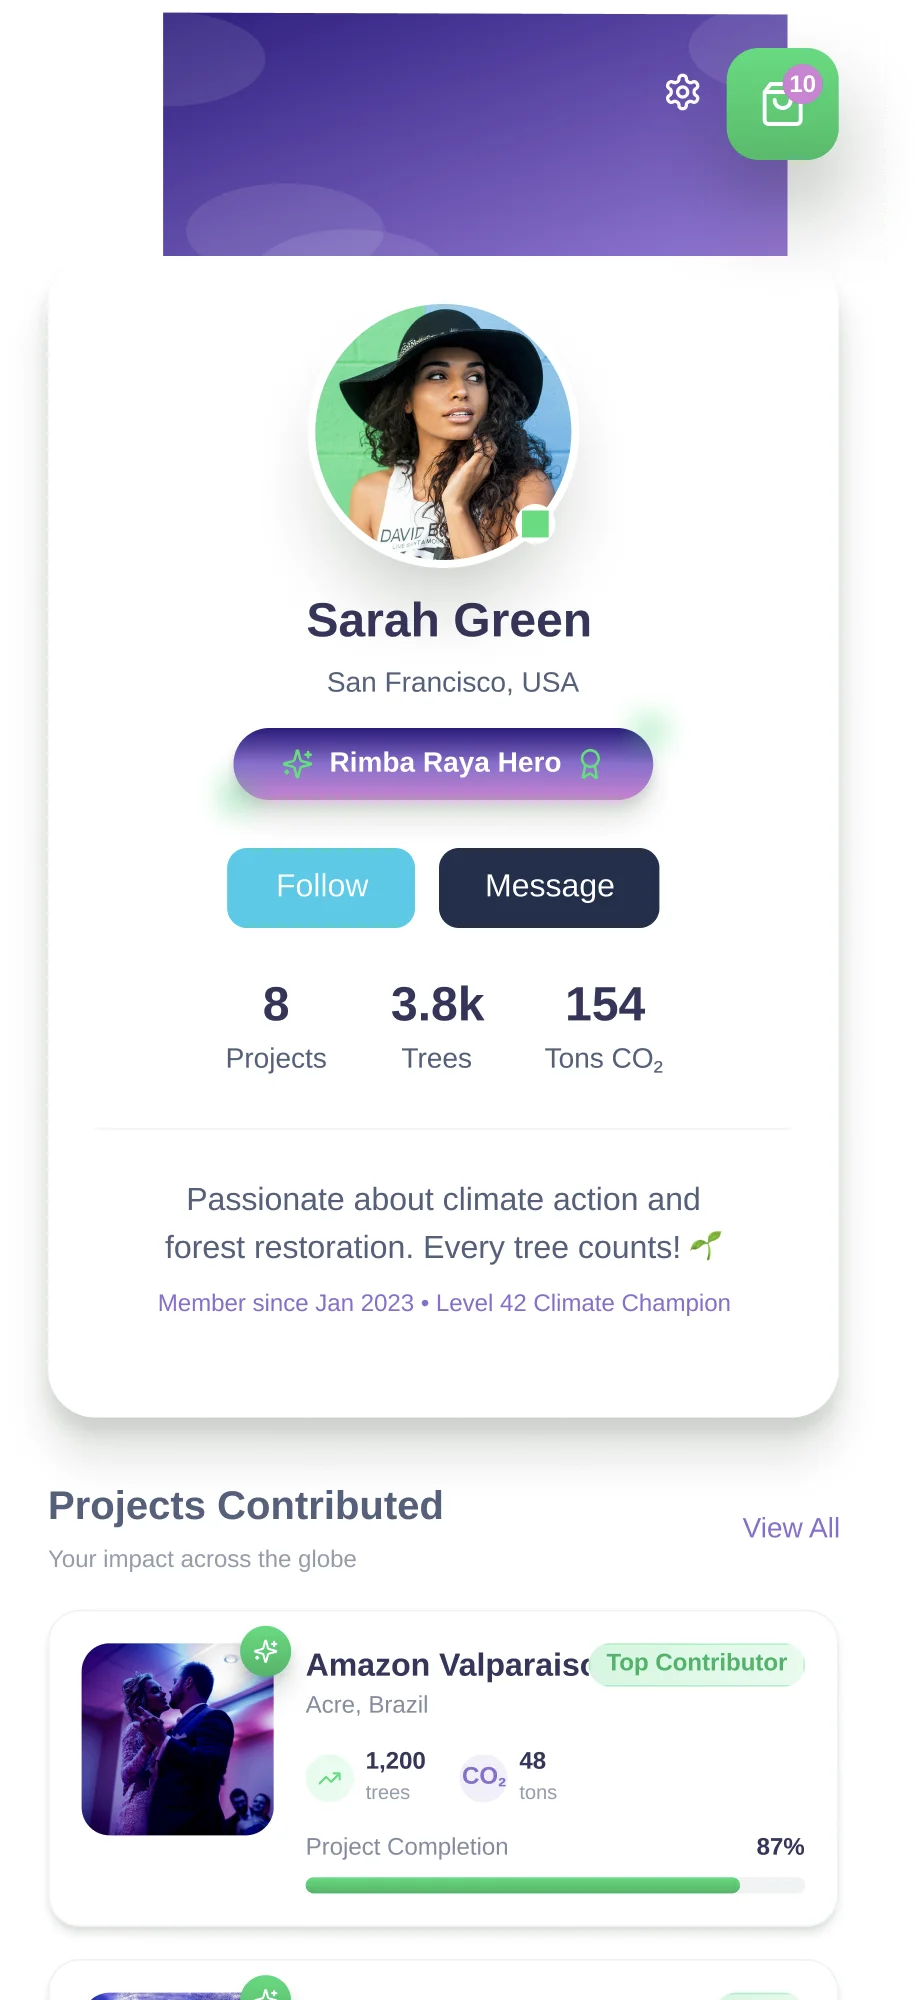
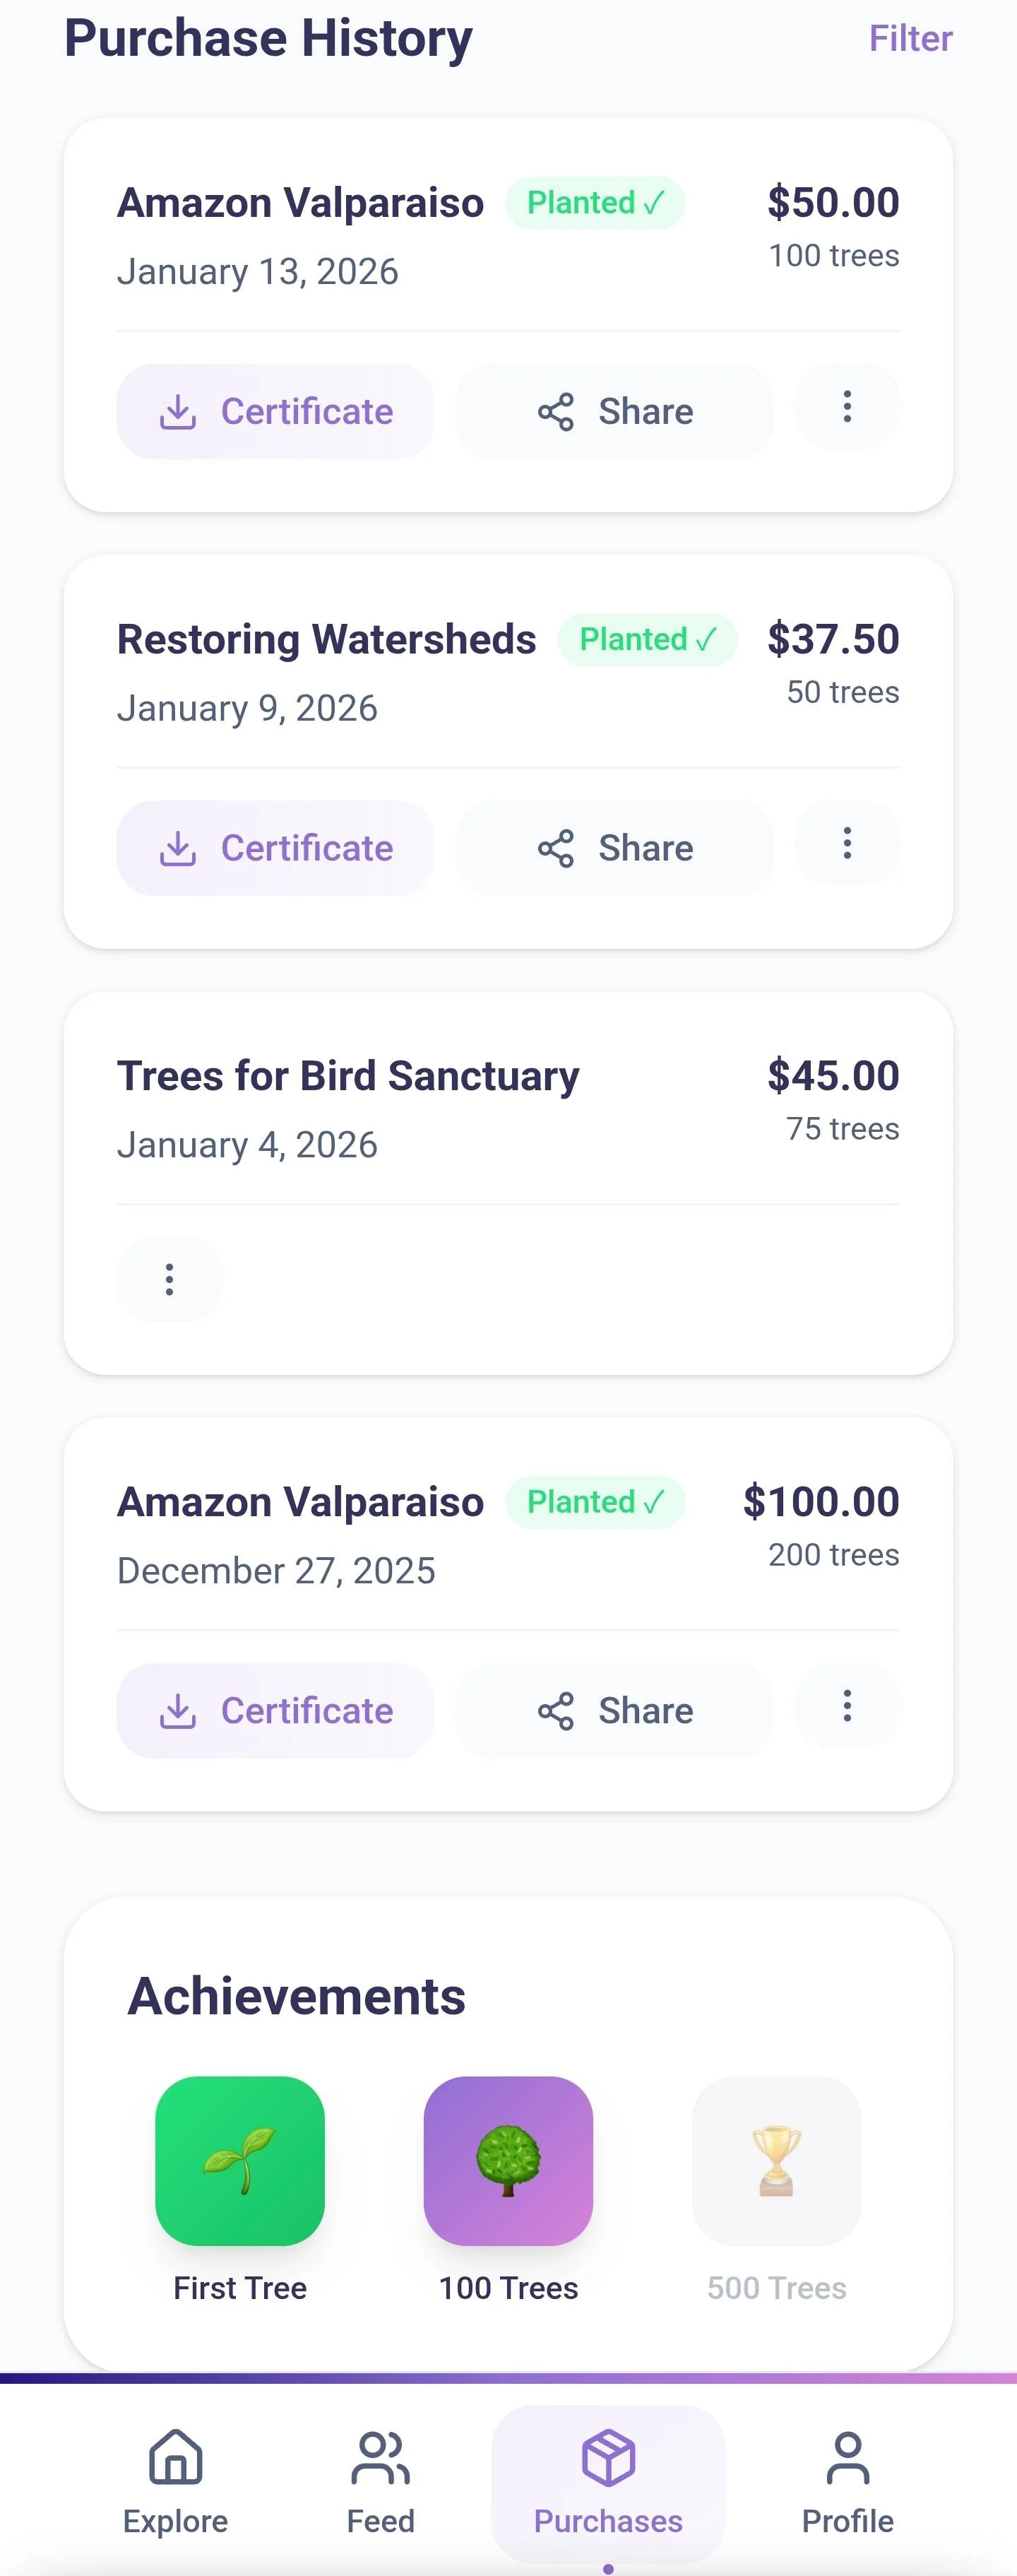
During the engagement, there was discussion about adding social features to increase engagement and create accountability among users. While this wasn't part of my core scope, I've since explored what this might look like. These concepts extend the research findings into new territory - the leaderboard addresses the "emotional connection" gap by making other contributors visible, customizable profiles give users a way to build identity around their environmental impact, and a gamified purchase history turns the harm-reduction model itself into something worth tracking and revisiting.
Project leaderboards create light social accountability and make collective impact tangible.
Customizable profiles to build user identity.
Purchase history reframed as achievements.
Note: These are personal explorations, not user-tested designs. The visual patterns are borrowed from familiar social media and mobile game interfaces.
05 / Reflection
Conclusion
The redesigned screens were handed off to engineering and incorporated into the MVP build. While the product ultimately pivoted before full launch, the research synthesis I conducted helped clarify the core user tensions that any carbon offset product would need to address: making sustainability effortless while maintaining emotional investment in outcomes.
![Engineering handoff mockup for the Amazon Valparaiso subscription card, using bracketed spec shorthand — [Next Payment $ + Date] and [Active / Cancelled / Error] — paired with a separate page of written notes for the engineer.](/assets/img5.webp)